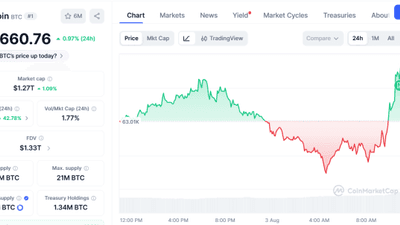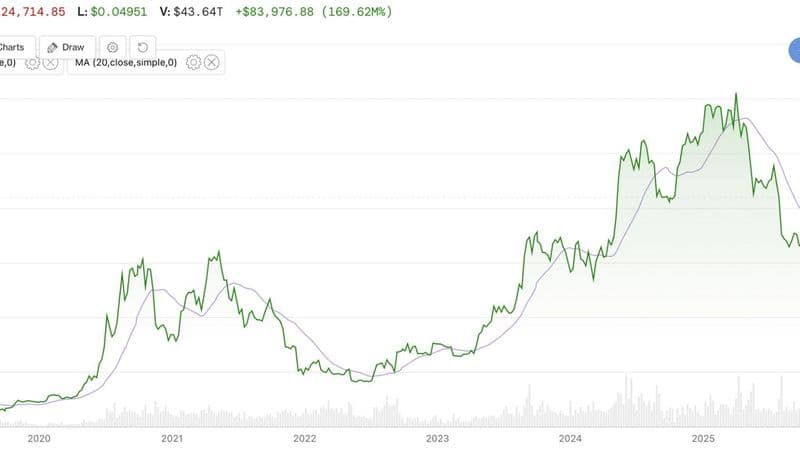
Bitcoin pushed back above its 365-day simple moving average on Sept. 22, trading close to $80,900 after a brief slide that saw the price dip to roughly $82,900. The move ended a 310-day stretch where the cryptocurrency lingered beneath that benchmark.
Historical outcomes of similar breakouts
Altcoin Pro’s research shows that in five earlier episodes where Bitcoin rose back over its 365-day average after at least three months below, the asset posted higher prices a year later. Gains in those cases spanned from about 59% to more than 1,400%, with the most dramatic increase occurring in 2012 when Bitcoin was still a niche asset. The same study also identified two instances—July 2018 and March 2022—where the rebound proved short-lived, leading to declines of roughly 27% and 59% within the following 90 days.
Analyst perspective on the signal
Founders of Altcoin Pro, Ryan Horst and Joni Zhuleku, remain cautiously optimistic, noting that their longer-term bullish stance hinges more on Bitcoin maintaining a position above its 200-day moving average. Their calculations place that average near $70,800, with Bitcoin currently trading about 19% higher. They describe the 365-day line as a slower-moving indicator, reflecting price conditions from roughly six months ago, whereas the 200-day line captures trends from about three months prior.
Complementary technical cues
A separate technical event occurred on Sept. 8 when Bitcoin’s 50-day moving average crossed above the 200-day line, forming a “golden cross.” While the pattern has produced mixed results historically, analysts argue that its significance is heightened when it follows an extended period below the 200-day average. Bitcoin spent 293 days under that level before the recent crossover, a shorter duration than the 436-day stretch experienced during the 2022-23 bear market.
Potential near-term hurdles
The next challenge for Bitcoin will be whether the modest pullback observed over the past 36 hours can push the price back toward the 200-day support zone. A decisive test around that threshold could clarify whether the broader bullish narrative holds or if the recent advance was merely a temporary bounce.
Why it matters
Crossing the 365-day moving average revives a technical narrative that has preceded sizable rallies in the past, offering a signal that market participants watch closely. However, the pattern is not foolproof; prior failures and the need for confirmation from the 200-day average underscore the uncertainty. Investors and traders will likely monitor price action around these averages to gauge the strength of the current uptrend and to assess the risk of an imminent correction.