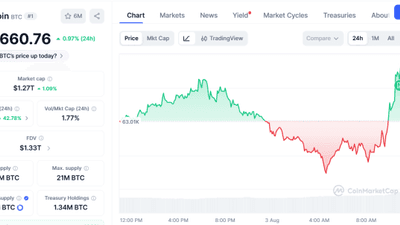
Bitcoin has not posted a single daily close below its realized price during the current bear market, keeping the June 2026 low above the aggregate cost basis of all holders. This behavior marks the shallowest bottom in Glassnode’s historical set that stretches back to 2017.
Realized-price metric stays intact
The realized-price indicator tracks whether the average holder, taken together, is underwater. In prior cycles – 2018-19 and 2022-23 – Bitcoin traded below that level for months, triggering prolonged capitulation. In 2026, however, no closing price slipped beneath the cost basis. While the percentage of supply in profit dipped to a level similar to the November 2022 trough, net unrealized profit/loss (NUPL) remained positive throughout, indicating that aggregate losses were modest compared with earlier downturns.
On-chain signals and resistance zones
Current price sits above the "True Market Mean" around $77,000 and also above the short-term holder cost basis that capped most of 2026’s rallies. The nearest sizable long-term holder cluster is concentrated at $84,000-$85,000, just above today’s price. The next significant hurdle is the mean MVRV price near $96,700, where average unrealized profit returns to its long-run norm.
Deribit options data reinforces these levels. Positive gamma has built up sharply near $95,000, while negative gamma occupies the band between spot and $92,000. This pattern suggests dealer hedging may accelerate moves when price approaches the lower band and dampen them near the MVRV mean.
ETF inflows and exchange volume
U.S. spot Bitcoin ETFs recorded roughly $1.3 billion of net inflows over five trading days following the recent price squeeze, reversing a two-week outflow streak. The influx represents the strongest single-day inflow since early July and highlights an institutional demand not present in the 2018 or 2022 downturns.
Spot-market volume across exchanges has more than doubled since the August trough, up 121% since the rally began. Historically, volume spikes in this period coincided with price declines, but the current surge aligns with rising prices, indicating a different market dynamic. The seven-day average volume remains about 30% below the same period a year ago, suggesting the market is recovering from a floor rather than fully reverting to 2025 levels.
Why it matters
By staying above the realized-price line, Bitcoin’s current bear market imposes less structural pressure on holders, reducing the likelihood of forced selling that deepened previous cycles. Combined with growing institutional ETF inflows and a healthier on-chain cost-basis profile, the market may sustain a rally toward the $96,700 MVRV mean, provided price can hold above the $84,000-$85,000 long-term holder cluster. A breach of that cluster could reopen the path to the $77,000 support and undermine the shallow-bear-market narrative.